Where should a foreign buyer put $1 million in residential property in 2026? This Bramwell & Partners benchmark, built on market data to 28 September 2026, compares nine cities on identical terms: Dubai, Abu Dhabi, London, New York, Singapore, Sydney, Paris, Amsterdam and Moscow. It uses the same $1M apartment, the same buyer (a non-resident foreign individual) and the same currency (US dollars) for every city.
Abu Dhabi comes first on our headline measure, the five-year cash return. It finishes ahead of Dubai and far ahead of every mature market. This article goes through the numbers, shows where Abu Dhabi leads and where it does not, and sets out what we think they mean for anyone weighing Abu Dhabi property investment against the alternatives.
Abu Dhabi property investment at a glance
- Net rental yield: 4.3% in Abu Dhabi on a $1M apartment, against 3.0% in London, 2.2% in New York and 1.5% in Singapore.
- Tax: 0% on rent, 0% on capital gains and no inheritance tax in the UAE. London taxes rent at 20% to 45%, Paris at 37% or more.
- Cost to buy: 4.3% of the price in Abu Dhabi, against 6.4% in Dubai, 11.3% in London, 15.6% in Sydney and 63.1% in Singapore.
- Round trip: buying and selling in Abu Dhabi costs 4.4% in total, the lowest of the nine cities.
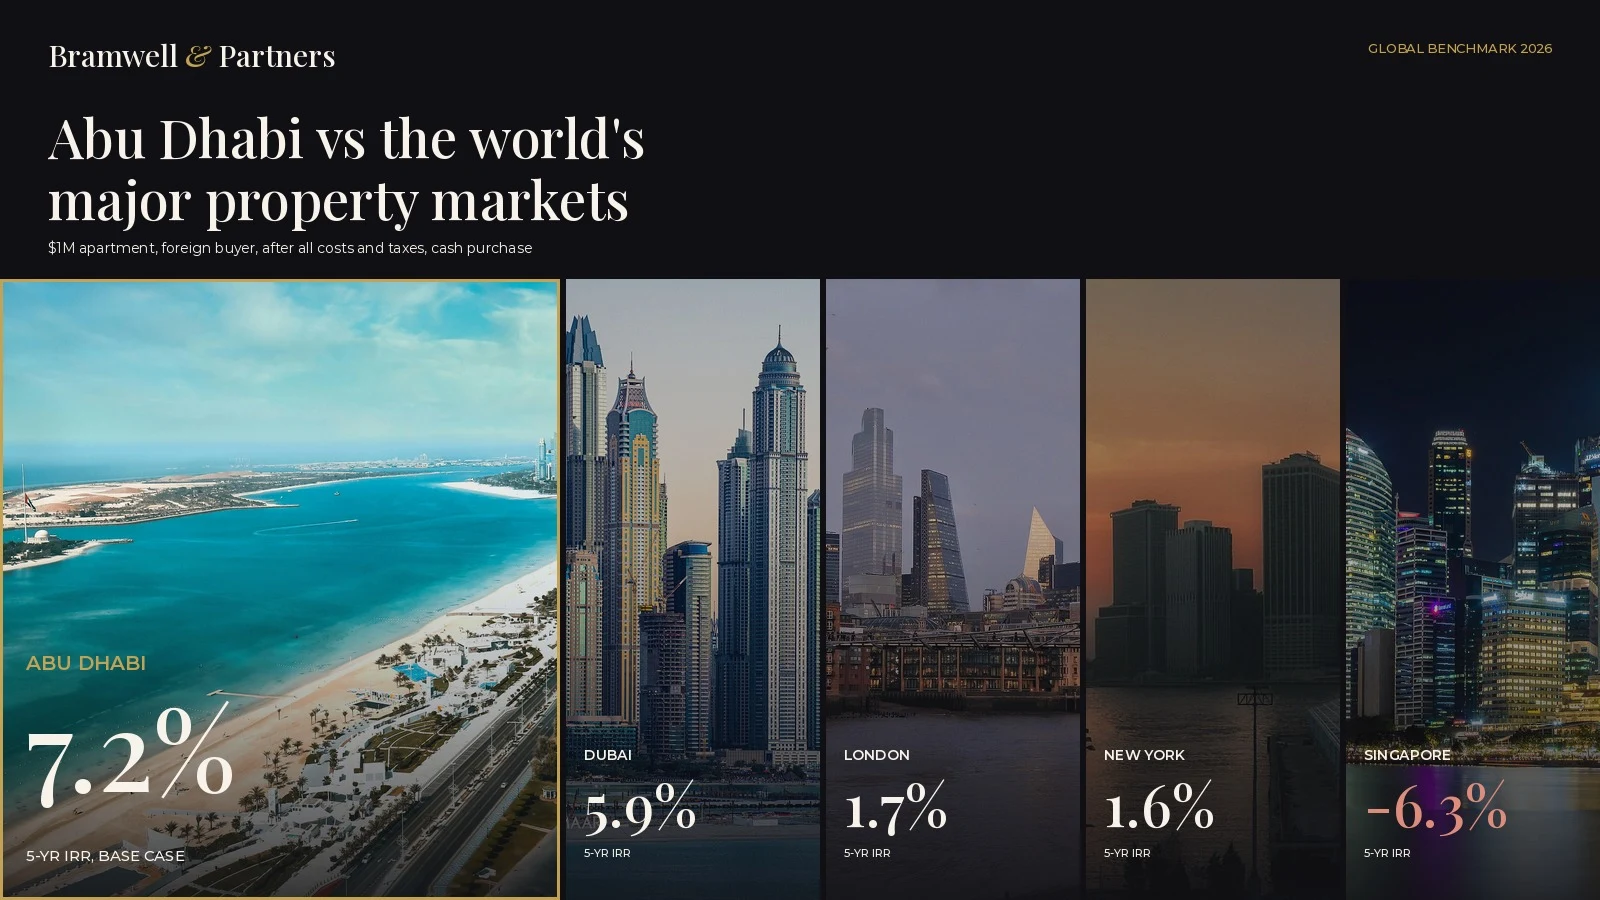
- Five-year return: a base-case cash IRR of 7.2% in Abu Dhabi, 5.9% in Dubai, 1.7% in London, 1.6% in New York and -6.3% in Singapore.
- Financing: Abu Dhabi and Dubai are the only two markets where the rent roughly covers a mortgage.
How the comparison was built
The comparison models a $1M apartment bought by a non-resident foreign individual, with all values in US dollars. In the UAE the asset is a two to three-bedroom apartment in Al Reem Island or Yas Island for Abu Dhabi, and a two-bedroom in Dubai Marina or Business Bay for Dubai. London is a two-bedroom flat in Zones 1 and 2, New York a one-bedroom condo in Manhattan, and Singapore a one to two-bedroom condo in the Rest of Central region. Costs, taxes, mortgage terms and rents come from local sources such as ADREC, ValuStrat, DLD, ONS and the Land Registry.
Two cautions before the numbers. First, the five-year return figures are scenario results built on assumed price growth, not forecasts. Second, any model carries its own assumptions, so we have flagged where the picture is less flattering to Abu Dhabi.
Net rental yield: UAE leads, London is third
Gross yield is the annual rent divided by the price. Net yield takes off running costs. Dubai and Abu Dhabi sit well clear of the field on both measures.
| City | Gross yield | Net yield |
|---|---|---|
| Dubai | 6.2% | 4.4% |
| Abu Dhabi | 6.0% | 4.3% |
| London | 4.8% | 3.0% |
| Moscow | 4.0% | 2.7% |
| Paris | 3.6% | 2.4% |
| Amsterdam | 3.6% | 2.4% |
| New York | 5.0% | 2.2% |
| Sydney | 4.0% | 1.9% |
| Singapore | 2.9% | 1.5% |
New York shows the pattern in other markets. Its gross yield of 5.0% looks respectable, but running costs of about $26,000 a year on a $1M apartment pull the net figure down to 2.2%. The same costs in Abu Dhabi are about $13,850.
What you keep after tax
The gap widens once tax on rent is taken out. In the UAE there is none, so the net yield is also the after-tax yield. Elsewhere, tax cuts the return again.
| City | Tax on rent | Capital gains tax | Inheritance tax |
|---|---|---|---|
| Abu Dhabi and Dubai | 0% | 0% | None |
| London | 20% to 45% | 24% | 40% |
| New York | About 30% | About 27% | Up to 40% |
| Singapore | 24% | 0% | None |
| Sydney | 30% or more | 30% to 45% | None |
| Paris | 37% or more | 36% or more | Up to 45% |
| Amsterdam | None, but Box 3 wealth tax of about 1.9% of value a year | 0% (Box 3) | Up to 40% |
| Moscow | 30% of gross rent | 0% after 5 years | None |
Putting it in dollars, here is where the first year of rent goes on a $1M apartment bought with cash.
| City | Rent collected | Running costs | Tax on rent | You keep |
|---|---|---|---|---|
| Dubai | $58,900 | $14,445 | $0 | $44,455 |
| Abu Dhabi | $57,000 | $13,850 | $0 | $43,150 |
| London | $46,080 | $16,451 | $5,926 | $23,703 |
| New York | $48,500 | $26,380 | $0 | $22,120 |
| Sydney | $39,000 | $19,610 | $1,317 | $18,073 |
| Moscow | $38,000 | $11,260 | $11,400 | $15,340 |
| Paris | $34,560 | $10,303 | $9,024 | $15,233 |
| Singapore | $27,260 | $11,939 | $5,561 | $9,760 |
| Amsterdam | $34,920 | $10,968 | $19,423 | $4,529 |
A Abu Dhabi owner keeps about $43,150 a year per $1M. A London owner keeps $23,703, and an Amsterdam owner under $4,600. The UAE is the only place in the comparison where rent pays a real after-tax return.
Cost to buy, hold and sell
Entry and exit costs decide how long a property has to be held before it pays. We priced a $1M resale home bought by a foreign individual.
| City | Cost to buy | Holding cost a year | Cost to sell | Round trip |
|---|---|---|---|---|
| Abu Dhabi | 4.3% | 1.39% | 0.1% | 4.4% |
| Moscow | 1.3% | 1.13% | 3.5% | 4.8% |
| Dubai | 6.4% | 1.44% | 0.1% | 6.5% |
| New York | 2.2% | 2.64% | 7.3% | 9.5% |
| Amsterdam | 9.5% | 3.04% | 1.6% | 11.1% |
| Paris | 7.8% | 1.03% | 4.1% | 11.9% |
| London | 11.3% | 1.65% | 2.0% | 13.3% |
| Sydney | 15.6% | 1.96% | 2.7% | 18.3% |
| Singapore | 63.1% | 1.19% | 2.4% | 65.5% |
New York is cheap to buy at 2.2% and then costs about 7% to sell. Singapore's 60% foreign-buyer tax makes a foreign purchase there a different proposition altogether. London adds a 2% surcharge on top of stamp duty, and Sydney a 9% surcharge plus land tax. Abu Dhabi charges 4.3% to buy and 0.1% to sell, so a buyer starts a hold period with the smallest hurdle of the nine.
Price growth: Dubai's record, Abu Dhabi's momentum
| City | Price change, last 12 months | Growth, 5 years a year (USD) |
|---|---|---|
| Abu Dhabi | +17.8% | +8.2% |
| Moscow | +14.6% | +8.5% |
| New York | +4.2% | +2.1% |
| Singapore | +2.9% | +7.2% |
| Paris | +0.6% | -2.7% |
| Amsterdam | +0.1% | +4.1% |
| Dubai | -1.7% | +15.7% |
| London | -3.3% | +2.3% |
| Sydney | -4.6% | +0.5% |
Dubai has the strongest five-year record at +15.7% a year, but it also has the deepest history of falls: about -50% in 2008, -29% between 2014 and 2020 and -10% in 2026. Abu Dhabi has gained 17.8% over the last year while Dubai slipped 1.7%. Long-term data for Abu Dhabi is limited, so there is no ten-year figure and no record of worst falls. Moscow's +14.6% sits beside sanctions, capital controls and a ruble that lost 12.8% against the dollar over five years.
Five-year returns: bear, base and bull
This is the central table. It models all-cash purchases of a $1M apartment held for five years, after all costs and taxes, with currencies held flat.
| City | Bear IRR | Base IRR | Bull IRR |
|---|---|---|---|
| Abu Dhabi | 1.2% | 7.2% | 11.2% |
| Dubai | -0.2% | 5.9% | 9.8% |
| Moscow | -3.3% | 2.5% | 5.4% |
| London | -2.2% | 1.7% | 3.8% |
| New York | -2.4% | 1.6% | 3.1% |
| Sydney | -4.5% | 1.2% | 3.3% |
| Amsterdam | -1.9% | 1.2% | 3.1% |
| Paris | -2.7% | 0.6% | 2.2% |
| Singapore | -9.9% | -6.3% | -4.5% |
Abu Dhabi is the only one of the nine markets with a positive return in the bear case. On $1M of capital, which covers the price plus all buying costs, we put the five-year cash profit at about $384,000 in Abu Dhabi and $304,000 in Dubai. London and New York each come to about $86,000, and Singapore shows a loss of $273,000. The same apartment buys 1,760 sq ft in Abu Dhabi against 1,500 sq ft in Dubai, 747 sq ft in London, 618 sq ft in New York and 296 sq ft in Singapore.
It is fair to say where part of the lead comes from. The model assumes price growth of -2%, +4% and +8% a year in Abu Dhabi for the bear, base and bull cases, against -3%, +3% and +7% in Dubai. Abu Dhabi's lower costs and tax-free income also feed straight into its return. The ranking holds, but a reader should treat the exact percentages as inputs to a model and not as a promise.
Financing: where rent covers the loan
We also tested the same apartment with a mortgage. Loan rates exceed rental yields in every market, so borrowing lowers returns almost everywhere.
| City | Loan-to-value and rate | Loan payment a year | Cash flow after loan and tax | Rent cover |
|---|---|---|---|---|
| Dubai | 60% at 5.0% | $42,571 | +$1,884 | 1.04x |
| Abu Dhabi | 60% at 5.0% | $42,571 | +$579 | 1.01x |
| London | 60% at 6.5% | $49,189 | -$19,560 | 0.60x |
| Singapore | 75% at 1.9% | $33,029 | -$19,849 | 0.46x |
| Paris | 70% at 4.1% | $51,964 | -$27,707 | 0.47x |
| New York | 60% at 7.5% | $50,803 | -$28,683 | 0.44x |
| Amsterdam | 60% at 5.0% | $39,031 | -$23,702 | 0.39x |
| Sydney | 60% at 7.5% | $50,803 | -$31,413 | 0.38x |
In Abu Dhabi the rent covers the loan 1.01 times. With leverage, the base-case five-year IRR rises to 9.3% in Abu Dhabi and 6.5% in Dubai, while every other market with a mortgage turns negative, from -1.0% in Amsterdam to -14.5% in Singapore. Leverage cuts both ways, though. In the bear case the leveraged return falls to -5.5% in Abu Dhabi and -9.3% in Dubai. Moscow offers no mortgages to foreigners.
Abu Dhabi vs Dubai: head to head
The two UAE markets share the same tax regime, the same US dollar peg and the same Golden Visa threshold of $545,000 for property buyers. They differ in price, supply and liquidity.
| Measure | Dubai | Abu Dhabi |
|---|---|---|
| Price per sq ft | $445 | $393 ready, $573 off-plan |
| Apartment gross yield | 6.7% | 3.5% to 7.6% by island |
| Price change, last 12 months | -1.7% | +17.8% |
| Growth, 5 years a year | +15.7% | +8.2% |
| Supply ahead | 162,500 homes scheduled for 2027 | 71,000 by 2030 |
| Off-plan share of sales | 68% | 84% to 89% |
| Resale liquidity | Deep | Thin |
| Round-trip cost | 6.5% | 4.4% |
| Oversupply risk | High | Moderate |
| Developer and off-plan risk | High | Moderate |
| Base-case five-year IRR (cash) | 5.9% | 7.2% |
For a $2.5M prime home the order on return is the same, with a cash IRR of 6.1% in Abu Dhabi against 5.3% in Dubai. Dubai's net yield is higher at that level, 3.8% against 3.1%, and Abu Dhabi's home is larger at 2,937 sq ft against 2,400 sq ft.
Where Abu Dhabi is weaker
A comparison that only lists strengths is not much use to a buyer. These are the points that count against Abu Dhabi.
- Resale liquidity is thin. We rate liquidity risk as high for Abu Dhabi, against moderate for Dubai. Plan for a hold of five years or more and do not count on a fast exit.
- Geopolitical risk is rated high, the same as Dubai and the same as Moscow. Both UAE markets sit in a region where events can move sentiment quickly.
- The price history is short. Abu Dhabi has no ten-year growth figure and no record of worst falls. A buyer is relying on fewer data points than in London or New York.
- Most stock is off-plan. Off-plan makes up 84% to 89% of sales, so delivery risk and choice of developer carry real weight.
- Leverage raises the downside. The 9.3% leveraged base return turns into -5.5% in the bear case.
Free Investor Guide
The Abu Dhabi Investment Guide
District-by-district yields, payment-plan mechanics, service charges and exit liquidity, everything we brief our private clients on, in one guide.
Get the Guide
We will send it straight to you.
Thank you.
The guide is on its way to your inbox. Our team may follow up once, no spam, ever.
Our view: the case for Abu Dhabi
We advise investors in Abu Dhabi every week, so we have a stake in this conversation and we say so. With that stated, the data supports a clear position. Abu Dhabi offers a yield within a tenth of a point of Dubai's, a lower cost of entry and exit, no tax on income or gains, a currency pegged to the dollar and a supply pipeline less than half the size of Dubai's. It also has the strongest bear case of the nine cities. Few markets let an investor buy for 4.3% and sell for 0.1%.
The practical advice follows from the weak points above. Buy with a five-year horizon. Favour completed or near-complete stock in established districts such as Saadiyat Island, Yas Island and Al Reem Island, where tenants and resale buyers already exist. For off-plan launches, choose master developers with a record of delivery and read the payment plan against your cash position. Keep any mortgage conservative, since the bear case shows how fast leverage works against you.
One more input belongs in the model. Our data runs to 28 September 2026, before Abu Dhabi's rent renewal framework took effect on 1 November. Annual rent increases at renewal are now capped, at 5% until 29 January 2027 and by the ADREC Rental Index after that. Anyone modelling rental growth beyond year one should read our guide to the Abu Dhabi rent increase cap. For the Dubai comparison from the off-plan side, see Abu Dhabi vs Dubai for off-plan investment, and for the basics start with our complete guide to off-plan property in Abu Dhabi.
Frequently asked questions
Is Abu Dhabi a good place to invest in property in 2026?
In our benchmark (data to 28 September 2026), Abu Dhabi ranks first of nine cities for five-year cash return on a $1M apartment, with a base-case IRR of 7.2%. It also has a 4.3% net rental yield, 0% rent and capital gains tax, and the lowest round-trip buying and selling cost of the nine markets at 4.4%. The main weaknesses are thin resale liquidity and limited long-term price history.
Is Abu Dhabi better than Dubai for property investment?
It depends on the goal. Dubai has deeper resale liquidity, a slightly higher net yield (4.4% against 4.3%) and stronger five-year price growth (+15.7% a year against +8.2%). Abu Dhabi has lower buying costs (4.3% against 6.4%), a lower oversupply risk, a higher modelled five-year return (7.2% against 5.9%) and rose 17.8% over the last year while Dubai fell 1.7%.
Which city has the highest rental yield for foreign buyers?
Dubai has the highest net yield of the nine cities at 4.4% on a $1M apartment, followed by Abu Dhabi at 4.3%. London is third at 3.0%. Every other market nets between 1.5% and 2.7% before the tax on rent that most of them charge.
Do foreigners pay tax on Abu Dhabi rental income?
Our benchmark models 0% tax on rental income, 0% capital gains tax and no inheritance tax for a non-resident foreign individual owning property in Abu Dhabi. By comparison, London taxes rent at 20% to 45% and Paris at 37% or more. Tax rules change and personal circumstances differ, so confirm your own position with a tax adviser.
How much does it cost to buy property in Abu Dhabi as a foreigner?
Our benchmark puts the cost to buy a $1M resale apartment in Abu Dhabi at 4.3% of the price, about $43,178. Dubai is 6.4%, London 11.3% and Sydney 15.6%. Selling costs are 0.1% in Abu Dhabi.
Can foreigners get residency by buying property in Abu Dhabi?
Our benchmark lists a Golden Visa for property purchases from $545,000 in both Abu Dhabi and Dubai. None of the other seven cities in the comparison offer residency through property ownership.
What is the expected five-year return on Abu Dhabi property?
Our benchmark models an all-cash five-year IRR of 7.2% in the base case, 1.2% in the bear case and 11.2% in the bull case for a $1M apartment. These are scenario results built on assumed price growth of -2%, +4% and +8% a year, not forecasts.
Methodology: Bramwell & Partners analysis, data to 28 September 2026. Figures are for a $1M apartment bought by a non-resident foreign individual, in US dollars, and scenario results are illustrations, not forecasts. This article is general information and not financial, tax or legal advice. Image credits: city photographs via Wikimedia Commons. Dubai Marina Skyline by Norlando Pobre (CC BY 2.0); London Skyline by It's No Game (CC BY 2.0); Manhattan Sunset by tom_bullock (CC BY 2.0); Marina Bay Singapore by Bijay Chaurasia (CC BY-SA 4.0).
Compare Abu Dhabi With Your Current Market
Tell us what you hold or are considering and we will run the numbers for Abu Dhabi.
Thank you.
Thank you, our team will be in touch shortly.
Keep Reading
Related Insights
Market News & Analysis
Abu Dhabi Rent Increase Cap 2026: How the New ADREC Renewal Rules Work
Abu Dhabi caps rent rises at 5% from 1 November 2026, then moves to the ADREC Rental Index on 30 January 2027…
Market News & Analysis
Abu Dhabi vs Dubai for Off-Plan Investment (2026)
Written by the Bramwell & Partners advisory team, Abu Dhabi real estate advisors. Last reviewed: October 2026. Every week, buyers ask us some version of…
Market News & Analysis
Modon & ADIB 75% Off-Plan Financing Explained
Written by the Bramwell & Partners advisory team, Abu Dhabi real estate advisors. Last reviewed: October 2026. On 7 July 2026, Modon Holding and Abu…